


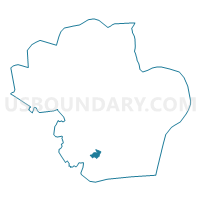
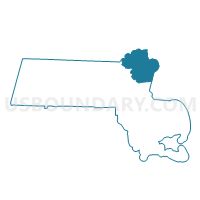
Census Tract 2022, Essex County, Massachusetts
About
Outline

Summary
| Unique Area Identifier | 463550 |
| Name | Census Tract 2022 |
| County | Essex County |
| State | Massachusetts |
| Area (square miles) | 1.89 |
| Land Area (square miles) | 1.33 |
| Water Area (square miles) | 0.56 |
| % of Land Area | 70.56 |
| % of Water Area | 29.44 |
| Latitude of the Internal Point | 42.46955970 |
| Longtitude of the Internal Point | -70.89744010 |
| Total Population | 5,888 |
| Total Housing Units | 2,412 |
| Total Households | 2,275 |
| Median Age | 46.2 |
Maps
Graphs
Select a template below for downloading or customizing gragh for Census Tract 2022, Essex County, Massachusetts


Neighbors
Neighoring Census Tract (by Name) Neighboring Census Tract on the Map
- Census Tract 2021.01, Essex County, MA
- Census Tract 2031, Essex County, MA
- Census Tract 2041.02, Essex County, MA
- Census Tract 2066, Essex County, MA
- Census Tract 9901, Essex County, MA
Top 10 Neighboring County Subdivision (by Population) Neighboring County Subdivision on the Map
- Lynn city, Essex County, MA (90,329)
- Salem city, Essex County, MA (41,340)
- Marblehead town, Essex County, MA (19,808)
- Swampscott town, Essex County, MA (13,787)
Top 10 Neighboring Place (by Population) Neighboring Place on the Map
- Lynn city, MA (90,329)
- Salem city, MA (41,340)
- Marblehead CDP, MA (19,808)
- Swampscott CDP, MA (13,787)
Top 10 Neighboring Unified School District (by Population) Neighboring Unified School District on the Map
- Lynn School District, MA (90,329)
- Salem School District, MA (41,340)
- Marblehead School District, MA (19,808)
- Swampscott School District, MA (13,787)
Top 10 Neighboring State Legislative District Lower Chamber (by Population) Neighboring State Legislative District Lower Chamber on the Map
- Seventh Essex District, MA (41,340)
- Eighth Essex District, MA (39,630)
- State House Districts not defined, MA (0)
Top 10 Neighboring State Legislative District Upper Chamber (by Population) Neighboring State Legislative District Upper Chamber on the Map
- Second Essex District, MA (164,671)
- Third Essex & Middlesex District, MA (154,037)
- State Senate Districts not defined, MA (0)
Top 10 Neighboring 111th Congressional District (by Population) Neighboring 111th Congressional District on the Map
Top 10 Neighboring 5-Digit ZIP Code Tabulation Area (by Population) Neighboring 5-Digit ZIP Code Tabulation Area on the Map
Explore Neighbors on the MapData
Demographic, Population, Households, and Housing Units
** Data sources from census 2010 **
Show Data on Map
Download Full List as CSV
Download Quick Sheet as CSV
| Subject | This Area | Essex County | Massachusetts | National |
|---|---|---|---|---|
| POPULATION | ||||
| Total Population Map | 5,888 | 743,159 | 6,547,629 | 308,745,538 |
| POPULATION, HISPANIC OR LATINO ORIGIN | ||||
| Not Hispanic or Latino Map | 5,766 | 620,414 | 5,919,975 | 258,267,944 |
| Hispanic or Latino Map | 122 | 122,745 | 627,654 | 50,477,594 |
| POPULATION, RACE | ||||
| White alone Map | 5,636 | 608,369 | 5,265,236 | 223,553,265 |
| Black or African American alone Map | 42 | 27,985 | 434,398 | 38,929,319 |
| American Indian and Alaska Native alone Map | 8 | 2,718 | 18,850 | 2,932,248 |
| Asian alone Map | 112 | 23,220 | 349,768 | 14,674,252 |
| Native Hawaiian and Other Pacific Islander alone Map | 0 | 303 | 2,223 | 540,013 |
| Some Other Race alone Map | 25 | 61,088 | 305,151 | 19,107,368 |
| Two or More Races Map | 65 | 19,476 | 172,003 | 9,009,073 |
| POPULATION, SEX | ||||
| Male Map | 2,866 | 356,615 | 3,166,628 | 151,781,326 |
| Female Map | 3,022 | 386,544 | 3,381,001 | 156,964,212 |
| POPULATION, AGE (18 YEARS) | ||||
| 18 years and over Map | 4,445 | 571,070 | 5,128,706 | 234,564,071 |
| Under 18 years | 1,443 | 172,089 | 1,418,923 | 74,181,467 |
| POPULATION, AGE | ||||
| Under 5 years | 301 | 43,632 | 367,087 | 20,201,362 |
| 5 to 9 years | 414 | 46,892 | 385,687 | 20,348,657 |
| 10 to 14 years | 467 | 49,534 | 405,613 | 20,677,194 |
| 15 to 17 years | 261 | 32,031 | 260,536 | 12,954,254 |
| 18 and 19 years | 97 | 19,857 | 202,220 | 9,086,089 |
| 20 years | 36 | 9,352 | 101,248 | 4,519,129 |
| 21 years | 29 | 8,887 | 96,372 | 4,354,294 |
| 22 to 24 years | 118 | 27,005 | 278,048 | 12,712,576 |
| 25 to 29 years | 141 | 42,595 | 441,525 | 21,101,849 |
| 30 to 34 years | 171 | 41,260 | 403,616 | 19,962,099 |
| 35 to 39 years | 346 | 46,090 | 418,195 | 20,179,642 |
| 40 to 44 years | 455 | 54,263 | 468,954 | 20,890,964 |
| 45 to 49 years | 517 | 61,497 | 515,434 | 22,708,591 |
| 50 to 54 years | 557 | 59,765 | 497,001 | 22,298,125 |
| 55 to 59 years | 555 | 51,695 | 432,822 | 19,664,805 |
| 60 and 61 years | 210 | 18,675 | 156,594 | 7,113,727 |
| 62 to 64 years | 254 | 25,046 | 213,953 | 9,704,197 |
| 65 and 66 years | 132 | 13,311 | 114,758 | 5,319,902 |
| 67 to 69 years | 166 | 17,174 | 149,701 | 7,115,361 |
| 70 to 74 years | 196 | 21,864 | 192,001 | 9,278,166 |
| 75 to 79 years | 136 | 18,862 | 162,592 | 7,317,795 |
| 80 to 84 years | 156 | 16,505 | 138,473 | 5,743,327 |
| 85 years and over | 173 | 17,367 | 145,199 | 5,493,433 |
| MEDIAN AGE BY SEX | ||||
| Both sexes Map | 46.20 | 40.40 | 39.10 | 37.20 |
| Male Map | 45.00 | 38.90 | 37.70 | 35.80 |
| Female Map | 47.10 | 41.80 | 40.30 | 38.50 |
| HOUSEHOLDS | ||||
| Total Households Map | 2,275 | 285,956 | 2,547,075 | 116,716,292 |
| HOUSEHOLDS, HOUSEHOLD TYPE | ||||
| Family households: Map | 1,720 | 188,005 | 1,603,591 | 77,538,296 |
| Husband-wife family Map | 1,475 | 136,841 | 1,178,690 | 56,510,377 |
| Other family: Map | 245 | 51,164 | 424,901 | 21,027,919 |
| Male householder, no wife present Map | 56 | 12,647 | 106,657 | 5,777,570 |
| Female householder, no husband present Map | 189 | 38,517 | 318,244 | 15,250,349 |
| Nonfamily households: Map | 555 | 97,951 | 943,484 | 39,177,996 |
| Householder living alone Map | 447 | 80,286 | 732,263 | 31,204,909 |
| Householder not living alone Map | 108 | 17,665 | 211,221 | 7,973,087 |
| HOUSEHOLDS, HISPANIC OR LATINO ORIGIN OF HOUSEHOLDER | ||||
| Not Hispanic or Latino householder: Map | 2,246 | 251,242 | 2,363,312 | 103,254,926 |
| Hispanic or Latino householder: Map | 29 | 34,714 | 183,763 | 13,461,366 |
| HOUSEHOLDS, RACE OF HOUSEHOLDER | ||||
| Householder who is White alone | 2,211 | 246,464 | 2,141,886 | 89,754,352 |
| Householder who is Black or African American alone | 13 | 9,297 | 150,977 | 14,129,983 |
| Householder who is American Indian and Alaska Native alone | 1 | 795 | 6,454 | 939,707 |
| Householder who is Asian alone | 36 | 6,571 | 109,022 | 4,632,164 |
| Householder who is Native Hawaiian and Other Pacific Islander alone | 0 | 86 | 684 | 143,932 |
| Householder who is Some Other Race alone | 7 | 17,687 | 93,230 | 4,916,427 |
| Householder who is Two or More Races | 7 | 5,056 | 44,822 | 2,199,727 |
| HOUSEHOLDS, HOUSEHOLD TYPE BY HOUSEHOLD SIZE | ||||
| Family households: Map | 1,720 | 188,005 | 1,603,591 | 77,538,296 |
| 2-person household Map | 776 | 72,789 | 646,935 | 31,882,616 |
| 3-person household Map | 384 | 45,123 | 389,107 | 17,765,829 |
| 4-person household Map | 359 | 41,501 | 342,062 | 15,214,075 |
| 5-person household Map | 157 | 18,339 | 147,354 | 7,411,997 |
| 6-person household Map | 39 | 6,422 | 50,366 | 3,026,278 |
| 7-or-more-person household Map | 5 | 3,831 | 27,767 | 2,237,501 |
| Nonfamily households: Map | 555 | 97,951 | 943,484 | 39,177,996 |
| 1-person household Map | 447 | 80,286 | 732,263 | 31,204,909 |
| 2-person household Map | 94 | 15,066 | 166,231 | 6,360,012 |
| 3-person household Map | 8 | 1,654 | 28,109 | 992,156 |
| 4-person household Map | 3 | 633 | 11,614 | 411,171 |
| 5-person household Map | 2 | 201 | 3,488 | 126,634 |
| 6-person household Map | 1 | 57 | 1,043 | 48,421 |
| 7-or-more-person household Map | 0 | 54 | 736 | 34,693 |
| HOUSING UNITS | ||||
| Total Housing Units Map | 2,412 | 306,754 | 2,808,254 | 131,704,730 |
| HOUSING UNITS, OCCUPANCY STATUS | ||||
| Occupied Map | 2,275 | 285,956 | 2,547,075 | 116,716,292 |
| Vacant Map | 137 | 20,798 | 261,179 | 14,988,438 |
| HOUSING UNITS, OCCUPIED, TENURE | ||||
| Owned with a mortgage or a loan Map | 1,414 | 138,604 | 1,177,473 | 52,979,430 |
| Owned free and clear Map | 492 | 43,968 | 409,685 | 23,006,644 |
| Renter occupied Map | 369 | 103,384 | 959,917 | 40,730,218 |
| HOUSING UNITS, VACANT, VACANCY STATUS | ||||
| For rent Map | 26 | 7,069 | 66,673 | 4,137,567 |
| Rented, not occupied Map | 0 | 371 | 3,822 | 206,825 |
| For sale only Map | 26 | 2,627 | 25,038 | 1,896,796 |
| Sold, not occupied Map | 8 | 714 | 6,408 | 421,032 |
| For seasonal, recreational, or occasional use Map | 48 | 5,512 | 115,630 | 4,649,298 |
| For migrant workers Map | 0 | 15 | 161 | 24,161 |
| Other vacant Map | 29 | 4,490 | 43,447 | 3,652,759 |
| HOUSING UNITS, OCCUPIED, AVERAGE HOUSEHOLD SIZE BY TENURE | ||||
| Total: Map | 2.59 | 2.54 | 2.48 | 2.58 |
| Owner occupied Map | 2.72 | 2.70 | 2.66 | 2.65 |
| Renter occupied Map | 1.91 | 2.26 | 2.18 | 2.44 |
| HOUSING UNITS, OCCUPIED, TENURE BY RACE OF HOUSEHOLDER | ||||
| Owner occupied: Map | 1,906 | 182,572 | 1,587,158 | 75,986,074 |
| Householder who is White alone Map | 1,863 | 169,668 | 1,443,462 | 63,446,275 |
| Householder who is Black or African American alone Map | 6 | 3,043 | 50,643 | 6,261,464 |
| Householder who is American Indian and Alaska Native alone Map | 0 | 234 | 2,233 | 509,588 |
| Householder who is Asian alone Map | 28 | 3,988 | 54,010 | 2,688,861 |
| Householder who is Native Hawaiian and Other Pacific Islander alone Map | 0 | 29 | 248 | 61,911 |
| Householder who is Some Other Race alone Map | 3 | 3,862 | 20,485 | 1,975,817 |
| Householder who is Two or More Races Map | 6 | 1,748 | 16,077 | 1,042,158 |
| Renter occupied: Map | 369 | 103,384 | 959,917 | 40,730,218 |
| Householder who is White alone Map | 348 | 76,796 | 698,424 | 26,308,077 |
| Householder who is Black or African American alone Map | 7 | 6,254 | 100,334 | 7,868,519 |
| Householder who is American Indian and Alaska Native alone Map | 1 | 561 | 4,221 | 430,119 |
| Householder who is Asian alone Map | 8 | 2,583 | 55,012 | 1,943,303 |
| Householder who is Native Hawaiian and Other Pacific Islander alone Map | 0 | 57 | 436 | 82,021 |
| Householder who is Some Other Race alone Map | 4 | 13,825 | 72,745 | 2,940,610 |
| Householder who is Two or More Races Map | 1 | 3,308 | 28,745 | 1,157,569 |
| HOUSING UNITS, OCCUPIED, TENURE BY HISPANIC OR LATINO ORIGIN OF HOUSEHOLDER | ||||
| Owner occupied: Map | 1,906 | 182,572 | 1,587,158 | 75,986,074 |
| Not Hispanic or Latino householder Map | 1,886 | 174,022 | 1,541,505 | 69,617,625 |
| Hispanic or Latino householder Map | 20 | 8,550 | 45,653 | 6,368,449 |
| Renter occupied: Map | 369 | 103,384 | 959,917 | 40,730,218 |
| Not Hispanic or Latino householder Map | 360 | 77,220 | 821,807 | 33,637,301 |
| Hispanic or Latino householder Map | 9 | 26,164 | 138,110 | 7,092,917 |
| HOUSING UNITS, OCCUPIED, TENURE BY HOUSEHOLD SIZE | ||||
| Owner occupied: Map | 1,906 | 182,572 | 1,587,158 | 75,986,074 |
| 1-person household Map | 267 | 37,482 | 337,783 | 16,453,569 |
| 2-person household Map | 765 | 61,774 | 547,166 | 27,618,605 |
| 3-person household Map | 352 | 31,921 | 276,048 | 12,517,563 |
| 4-person household Map | 329 | 31,560 | 261,809 | 10,998,793 |
| 5-person household Map | 152 | 13,304 | 110,229 | 5,057,765 |
| 6-person household Map | 38 | 4,330 | 36,086 | 1,965,796 |
| 7-or-more-person household Map | 3 | 2,201 | 18,037 | 1,373,983 |
| Renter occupied: Map | 369 | 103,384 | 959,917 | 40,730,218 |
| 1-person household Map | 180 | 42,804 | 394,480 | 14,751,340 |
| 2-person household Map | 105 | 26,081 | 266,000 | 10,624,023 |
| 3-person household Map | 40 | 14,856 | 141,168 | 6,240,422 |
| 4-person household Map | 33 | 10,574 | 91,867 | 4,626,453 |
| 5-person household Map | 7 | 5,236 | 40,613 | 2,480,866 |
| 6-person household Map | 2 | 2,149 | 15,323 | 1,108,903 |
| 7-or-more-person household Map | 2 | 1,684 | 10,466 | 898,211 |
Loading...